Understanding the Z Value Table: A Simple Guide

The z value table is an important tool in statistics. It helps us find the probability of different outcomes in a normal distribution. When we talk about a normal distribution, we mean a way to show how data is spread out. The z value tells us how far away a data point is from the average. This can help us understand how likely something is to happen.
Using the z value table is easy once you know how it works. You start by calculating the z score for your data. This score tells you how many standard deviations your data point is from the mean. After that, you can look up your z score in the table to find the corresponding probability. This helps in making decisions based on data, whether in school or in real life.
What is a Z Value Table?
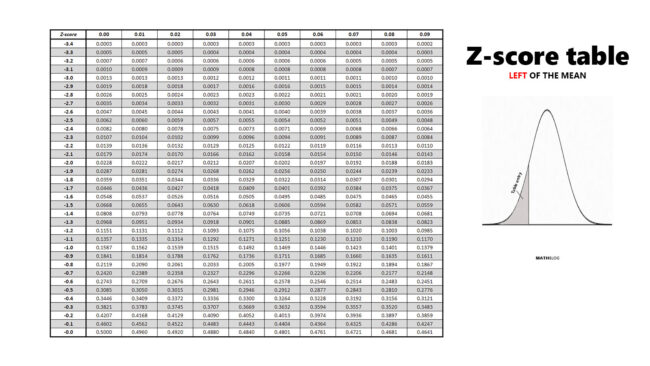
A z value table is like a map for statistics. It shows us the relationship between z scores and probabilities. Z scores tell us how far away a score is from the average. The table helps us see how common or rare that score is in a group of data. This is important because it helps us understand trends and make decisions.
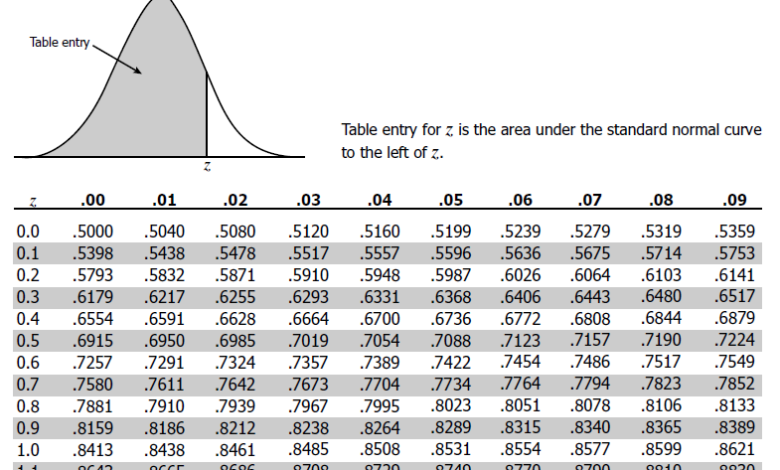
The table is set up in rows and columns. Each z score has a probability next to it. For example, if we have a z score of 1.00, the table might show that about 84% of scores fall below that. This means that if you score 1.00, you did better than most people. Knowing how to read the table is key to using it effectively.
How to Read a Z Value Table
Reading a z value table is not too hard. First, you need to find your z score. Z scores can be positive or negative. A positive z score means the value is above the average, while a negative score means it is below.
To read the table, start with your z score. For example, if you have a z score of 0.5, look for it in the table. Once you find it, look across the row to see the probability. This shows you the chance that a score falls below your z score.
Example of Finding Probabilities
- Positive Z Score: If your z score is 1.5, look it up and find the probability of about 0.9332. This means 93.32% of scores fall below yours.
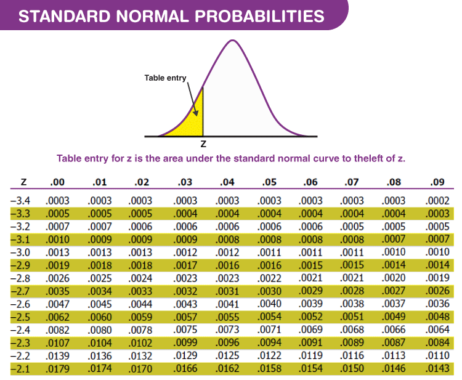
- Negative Z Score: For a z score of -1.0, the table shows 0.1587. This means 15.87% of scores are lower than yours.
Calculating Z Scores: A Step-by-Step Guide
To use the z value table, you first need to calculate your z score. The z score formula is:
z=(X−μ)σz = \frac{(X – \mu)}{\sigma}z=σ(X−μ)
Here, XXX is your score, μ\muμ is the mean, and σ\sigmaσ is the standard deviation.
Steps to Calculate Z Scores
- Find the Mean: Add up all your scores and divide by how many scores there are.
- Find the Standard Deviation: This tells you how spread out the scores are. Use the formula to calculate it.
- Plug in the Values: Use your score, the mean, and the standard deviation in the formula.
Once you have your z score, you can easily use the z value table to find probabilities.
Common Applications of the Z Value Table
The z value table is used in many fields. For example, it helps students understand test scores. It can also help businesses make decisions based on customer data. Here are some common ways to use the table:
- Education: Teachers can see how students perform compared to the average.
- Finance: Companies can analyze sales data and customer trends.
- Healthcare: Researchers can study health measurements across different populations.
Knowing how to use the z table can help in many areas. This knowledge allows people to make better decisions based on data.
Using the Z Value Table in Real Life
- For Students: Understanding your test scores in relation to the average class score.
- For Businesses: Analyzing customer satisfaction scores to improve services.
- For Researchers: Assessing the effectiveness of treatments in medical studies.
Conclusion: Mastering the Z Value Table for Better Data Understanding
Mastering the z value table is important for anyone working with statistics. It helps you understand data and make informed decisions. By learning how to calculate z scores and read the table, you can better analyze data in your studies or career.
The z value table provides valuable insights. It shows you how likely something is to happen based on past data. With practice, using the z value table will become second nature, helping you navigate through numbers with confidence.
FAQs
Q: What is a z score?
A: A z score tells you how far a value is from the average. It shows whether the value is above or below the average.
Q: How do I use the z value table?
A: First, calculate your z score. Then, find it in the table to see the corresponding probability.
Q: Why is the z value table important?
A: It helps us understand how data is spread out and find probabilities, which is useful in many fields like education and business.


